Intelligent Investment
Core and Value-Add Multifamily Metrics Improve in Q3
October 28, 2024 4 Minute Read

CBRE Research is pleased to announce the expansion of its quarterly Multifamily Underwriting Survey in Q3. In addition to the existing core (formerly called “prime”) asset metrics, those for value-add properties have been included for the first time. Four new markets—Charlotte, Indianapolis, Nashville and Tampa—have also been added for greater coverage of the Midwest and Southeast regions.
Following the first Fed rate cut in two years in September, metrics for both core and value-add multifamily assets improved across the board. These improvements indicate that the multifamily market is past the point of protracted stabilization and finally on the road to value recovery.
Figure 1: Quarter-over-Quarter Change in IRR Target & Cap Rates for Core Assets
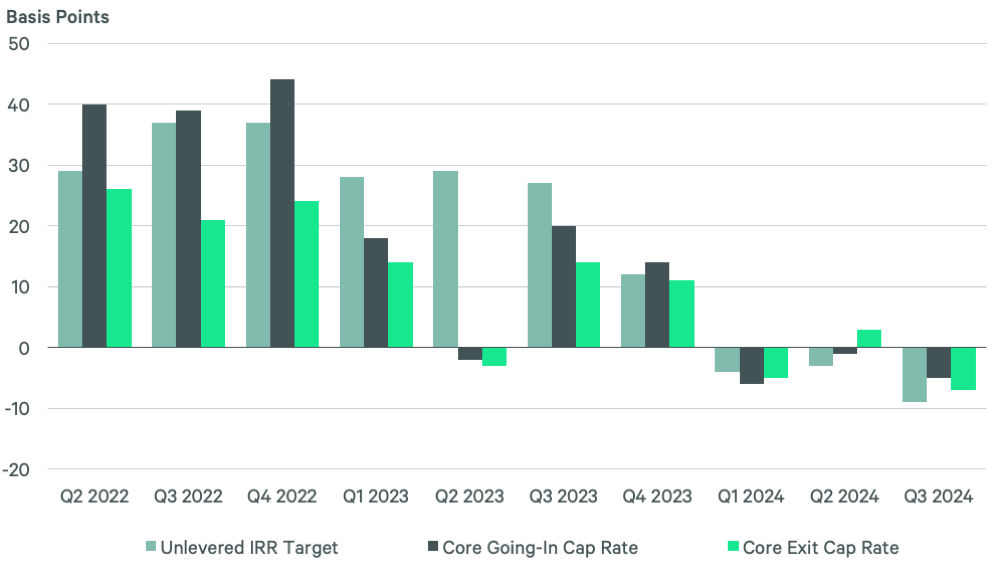
The average core multifamily going-in cap rate in Q3 fell by 5 basis points (bps) to 4.90%, while the average exit cap rate decreased by 7 bps to 5.05%. Core unlevered IRR targets fell substantially to 7.64%. Ten of the 19 markets tracked for this report had stable IRR targets for core assets in Q3. Six markets (Atlanta, Chicago, Denver, Nashville, Seattle and Washington, D.C.) saw reductions in their IRR targets of 25 bps or more. Only three markets (Los Angeles, Philadelphia and Tampa) had IRR target increases for core assets.
Figure 2: Going-In & Exit Cap Rate Spreads for Core Assets
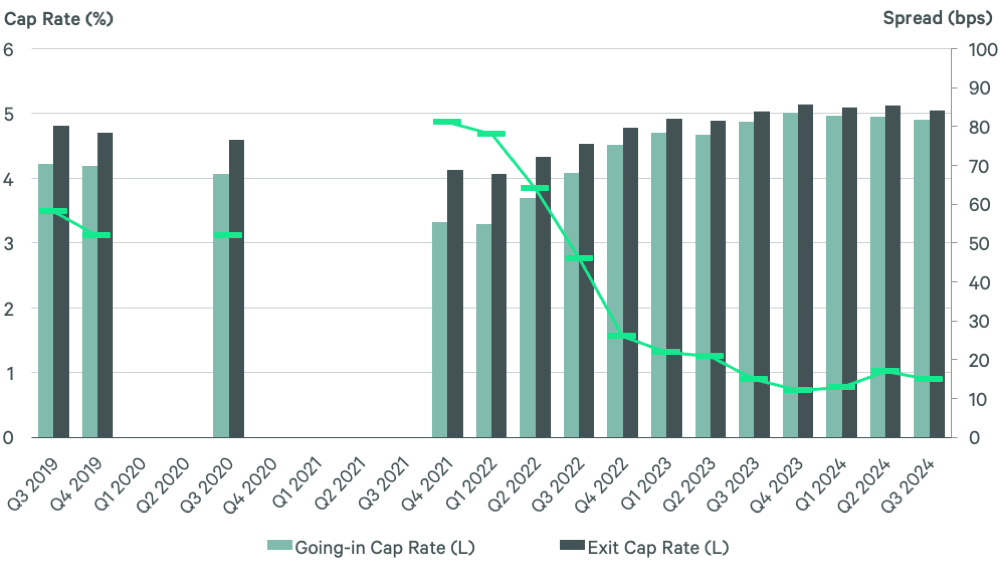
Source: CBRE Research, Q3 2024.
The spread between going-in and exit cap rates for core assets fell slightly to 15 bps in Q3, even as both going-in and exit cap rates compressed. However, the spread is still higher than its low of 12 bps in Q4 2023 and is expected to increase over the next two years as going-in cap rates compress more than exit cap rates and the Fed continues to cut rates.
Figure 3: Buyer Valuation Underwriting Assumptions for Prime Class A Multifamily Assets
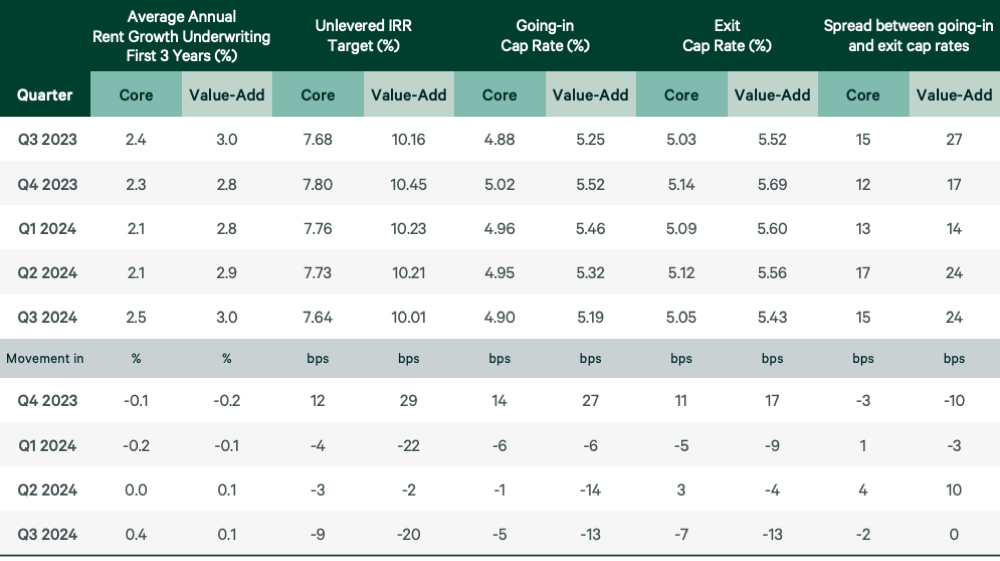
Value-add assets saw the biggest underwriting improvements in Q3. Going-in and exit cap rates both fell by 13 bps to 5.19% and 5.43%, respectively. The spread between going-in and exit cap rates was greater for value-add assets (24 bps) than core assets (15 bps). Additionally, unlevered IRR targets for value-add assets fell by 20 bps to 10.01%.
Figure 4: Buyer Valuation Underwriting Assumptions for Prime Class A Multifamily Assets by Market, Q2 2024
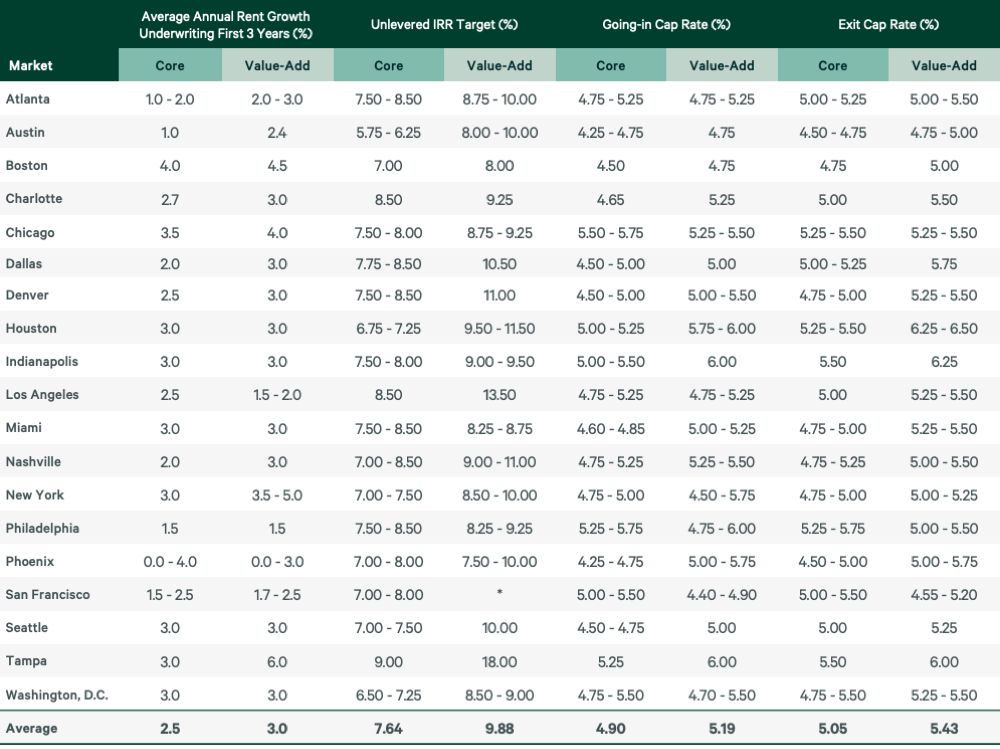
Note: Estimates are based on the expert opinion of local CBRE investment professionals.
Source: CBRE Research, Q3 2024.
Nine markets saw going-in cap rate compression for core assets, with five (Austin, Chicago, Denver, Indianapolis and New York) seeing decreases of 25 bps or more. Los Angeles was the only market with an increase in going-in cap rates for core assets (+50 bps), down from five markets with increases in Q2. For value-add assets, nine markets had lower going-in cap rates in Q3, while none had higher rates.
Although underwriting assumptions are changing more quickly in some markets than others, we expect less variation ahead as borrowing costs and cap rates trend down in response to the Fed’s rate-cutting cycle.
Related Service
- Property Type
Multifamily
Unlock the potential of your residential real estate with expert investment, financing, valuation, due diligence, design, management and leasing strat...